5. The ANOVA analysis in details
Contents
5.1. About the settings
When using the ANOVA instance or the
ANOVAReport to create an
HTML report (see HTML report), all tunable settings are accessible from an
attribute called settings:
from gdsctools import ANOVA, ic50_test
gdsc = ANOVA(ic50_test)
gdsc.settings
This settings attribute is an instance of gdsctools.settings.ANOVASettings, which is fully documented in the reference. For example in the HTML report section, we will change the default output directory where HTML pages are saved to a user-defined value.
It is also important to note that when calling ANOVAReport, the first argument is an ANOVA instance that already contains the settings. So, ANOVAReport will use that settings automatically (it may still be changed later). Consider this example:
>>> from gdsctools import ANOVA, ic50_test, ANOVAReport
>>> gdsc = ANOVA(ic50_test)
>>> gdsc.settings.FDR_threshold = 15
>>> results = gdsc.anova_all()

>>> ar = ANOVAReport(gdsc, results)
>>> ar.settings.FDR_threshold
15
We will see more settings here below but first let us come back on the ANOVA analysis.
5.2. Regression analysis
By default, the regression uses an OLS method. 4 Factors may be
taken into account depending on the content of the
GenomicFeature data set.
Here below, we use the R syntax where C() stands for categorical data and Y is
the variable to be explained. Depending on the data and the
gdsctools.anova.settings one of the following formula will be used:


Here are some rules applied:
- Feature factor is always included by definition and is in last position
- MSI and Media are included by default if found in the genomic feature data
set. Note, however than one can exclude these factors using the
settings. - Tissue is included if there are more than 2 tissues. Again, one can
change the
settings.analysis_typeto the name of the tissue (instead of PANCAN, the default value).
Note
The order of the different features in the equations may have an impact on the analysis.
Since analysis may be time-consuming, we have hard-coded the
regression formula. Note, however, that in version 0.16, we have
added the anova_one_drug_one_feature_custom()
method, which can be use for any type of regression based on a user formula.
This is slower than the hard-coded version mentionned above but is
more flexible. One can for instance set the formula to specify the treatement
to be used as a reference:
an.settings['regression_formula'] = "Y ~ C(tissue, Treatment(reference='breast'))"
The ANOVA analysis itself uses a type I error. The summary can be obtained for a specific combination of drug and feature as follows:
from gdsctools import *
an = ANOVA(ic50_test, gf_v17)
drugid = 1047
feature = an.feature_names[0]
odof = an._get_one_drug_one_feature_data(drugid, feature)
res = an.anova_one_drug_one_feature(drugid, feature)
an._get_anova_summary(an.data_lm, output="dataframe", odof=odof)
and should show the following summary:
              Df       Sum Sq    Mean Sq  F value       PR(>F)
tissue      26.0   352.345257  13.551741  9.26853  1.63864e-31
msi          1.0     5.309389   5.309389  3.63129    0.0570537
feature      1.0     3.186109   3.186109   2.1791     0.140282
Residuals  817.0  1194.554709   1.462123     None         None
An alternative (simpler but slower) way since version 0.16 is to use:
an.anova_one_drug_one_feature_custom(drugid, feature,
    formula='Y ~ C(tissue) + C(msi) + feature')
5.2.1. Type I error
The ANOVA analysis is based on a Type I error, also called sequential sum of squares. Consider 2 effects A and B, it tests the main effect of factor A, followed by the main effect of factor B after the main effect of A, followed by the interaction effect AB after the main effects. So, this type of sums of squares gives different results for unbalanced data depending on the sequence.
5.2.2. MSI factor
MSI is always included by default. However, you may exclude it by setting its value to False:
settings.include_MSI_factor
If MSI_FACTOR column is not found in the Genomic Feature data set, the MSI factor will be excluded automatically and the parameter above set to False.
Warning
If you force the MSI factor to True whereas there is not enough data in the binary sets of the MSI factor, error will be raised.
5.2.3. MEDIA factor
If included in the genomic feature data set, MEDIA are included by default. However, you may exclude it by setting its value to False:
settings.include_MEDIA_factor
If MEDIA_FACTOR column is not found in the Genomic Feature data set, the MEDIA factor will be set automatically to False.
5.2.4. Tissue factor
Another factor used in the regression (tissue) will be automatically excluded if there is only one tissue (or none). If several tissues are available, you can still exclude it from the regression analysis by settings this parameter to anything different from the default value (PANCAN):
settings.analysis_type = PANCAN
5.3. Filtering
When performing the analysis for a given drug and feature, the regression may not be performed if there is not enough statistics.
These parameters will influence the number of tests being performed (number of associations of drug vs feature in anova_all()):
- minimum_nonna_ic50
- MSI_feature_threshold
- feature_factor_threshold
The first parameter indicates the minimum number of valid IC50 required for a given drug to be analysed. The current default value is 6.
The second parameter indicates the minimum size of the positive and negative population when IC50 are filtered by MSI factor (defaults to 2).
The third parameter indicates the minimum size of the positive and negative population when IC50 are filtered by Feature factor (defaults to 3).
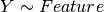
This table summarizes the effect of these parameters:
The left hand side table mimics the IC50 data. The first column should and last 3 rows are not to be included in an IC50 matrix (see Data Format and Readers) but are added here as annotations for the following discussions.
When the regression analysis is performed for a given drug and a given feature, 3 filters are applied. First, a minimum number of values is required (minimum_nonna_ic50 setting). Therefore, the drug is not analysed. The second check is performed with respect to the MSI values. A drug can be analysed only if (once NA have been discarded) the number of IC50s corresponding to positive and negative MSIs is greater or equal to MSI_feature_threshold. In our example, the drugs in column D_pMSI=0 and D_pMSI=1 are therefore discarded since they have zero and only one positive MSI, respectively.
Finally, similarly to the MSI check, a drug/feature association is analysed if the number of IC50s corresponding to positive and negative feature is or equal to feature_factor_threshold.
5.4. Multiple testing corrections
By default, the multiple testing correction is based on Benjamini–Hochberg (BH) method but it can be set to other methods using
settings.pval_correction_method
See also
MultipleTesting for details.
The multiple testing is performed globally across all drugs and all cell lines.This parameter is stored in
settings.pvalue_correction_level
By default it is set to global. Set it to local to keep the multiple correction at the drug level (ODAF).
When you perform an ANOVA analysis, the multiple correction method is used to populate the results column named ANOVA_FEATURE_FDR.
If you change your mind and wish to run the analysis with another method,
you do not need to re-run the entire analysis. Instead, simply change the
method’s name and call anova_all() again. Only the multiple testing computation is
performed, skipping ANOVA testing, which have already been done.
results = an.anova_all()
an.settings.pvalue_correction_method = 'qvalue'
results = an.anova_all()
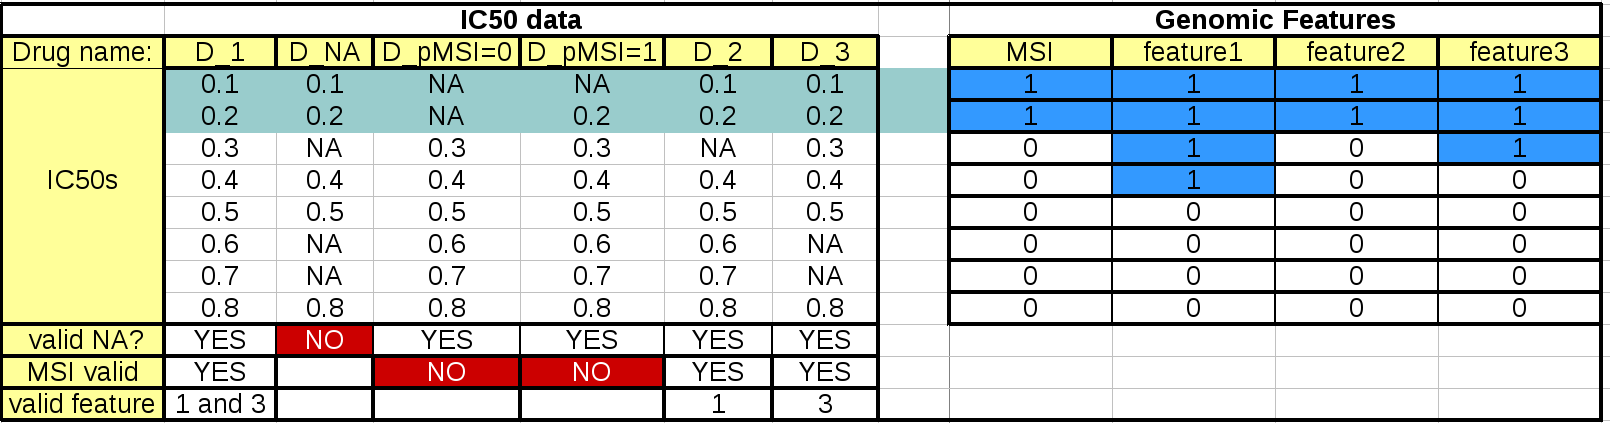
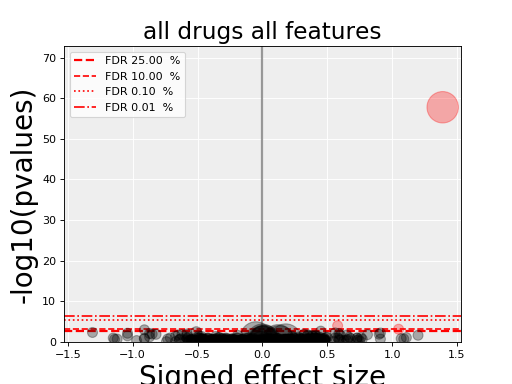
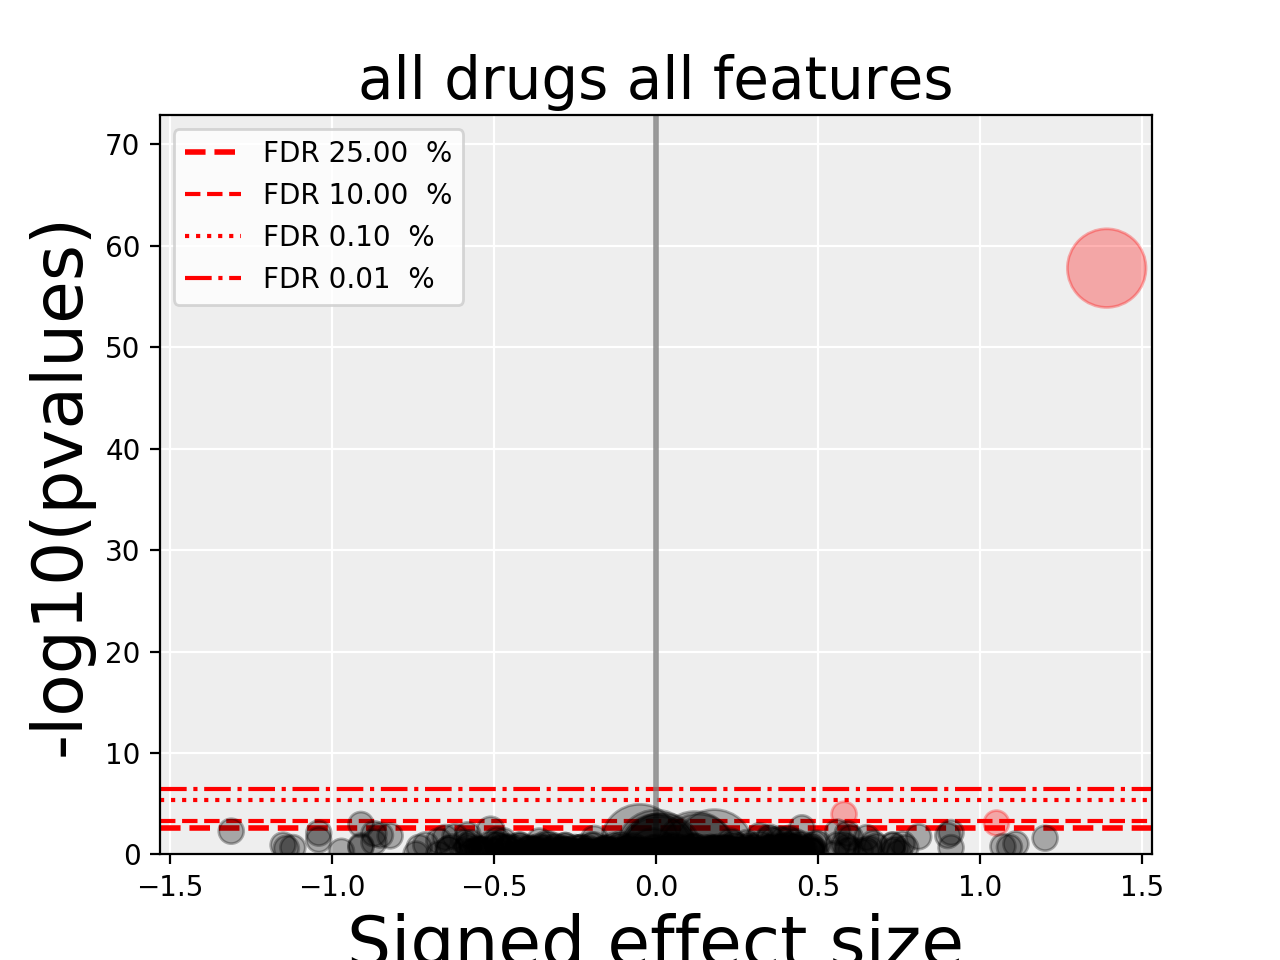
5.5. volcano plots
The volcano plots are one of the main results of the analysis and summarizes visually the significance of the different associations.
It is part of the AnovaResults class and is
returned either by an ODAF or ADAF analysis:
from gdsctools import ANOVA, ic50_test
gdsc = ANOVA(ic50_test)
res = gdsc.anova_all()
res.volcano()
(Source code, png, hires.png, pdf)

Here are some parameters used to tune the plots and selection of significant events:
- pvalue_threshold is used to select significant hits. See
ANOVAReport. - effect_threshold is used to select significant hits as well.
- FDR_threshold is used in
gdsctools.volcano.VolcanoANOVA(horizontal lines) - volcano_FDR_interpolation uses interpolation to plot the FDR lines in the volcano plot.
- volcano_additional_FDR_lines : [0.01, 0.1, 10]
See also
5.6. others
See ANOVASettings for the full listing.
Note
Some settings will be set automatically when calling some functions.
For instance, if you call anova.ANOVA.set_cancer_type() to a single
tissue, then the analysis_type will be set to the tissue’s name. If there
are not enough positive or negative MSI, the MSI factor will ignored.