12.2. Visualise genomic features
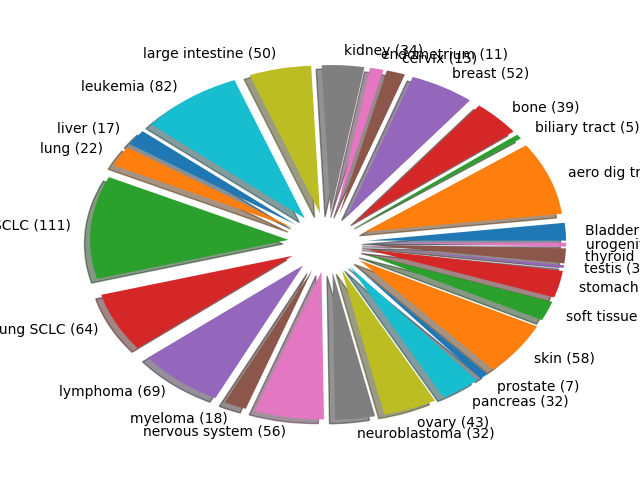
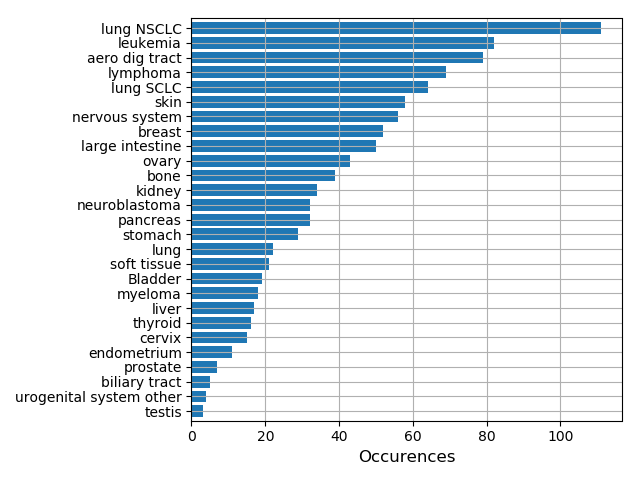
Here, we get a quick overview of the cancer cell types
from gdsctools import GenomicFeatures, gf_v17
Read the genomic featues (here version 17 of GDSC) and visualise the distribution of the different cancer types as a pie chart or bar plot
gf = GenomicFeatures(gf_v17)
gf.plot()
Total running time of the script: ( 0 minutes 0.528 seconds)